Note
Go to the end to download the full example code
DEM subtraction#
Subtracting one DEM with another should be easy!
This is why xdem (with functionality from geoutils) allows directly using the - or + operators on xdem.DEM objects.
Before DEMs can be compared, they need to be reprojected/resampled/cropped to fit the same grid.
The xdem.DEM.reproject() method takes care of this.
import geoutils as gu
import matplotlib.pyplot as plt

import xdem
We can print the information about the DEMs for a “sanity check”
[[585.1568603515625 593.7670288085938 599.27587890625 ...
  276.78131103515625 287.1056823730469 296.2648620605469]
 [585.667236328125 594.3804321289062 603.4343872070312 ...
  276.9458923339844 288.22772216796875 298.573486328125]
 [584.7866821289062 594.0465087890625 602.7151489257812 ...
  275.3355407714844 285.9632263183594 296.79010009765625]
 ...
 [360.0013122558594 359.192138671875 358.2886657714844 ...
  558.6853637695312 561.381103515625 565.4931640625]
 [360.65240478515625 359.96295166015625 359.01483154296875 ...
  543.9490966796875 546.5569458007812 550.02880859375]
 [361.43194580078125 360.63262939453125 359.747802734375 ...
  529.3741455078125 532.504150390625 537.7479248046875]]
[[589.0902709960938 593.20654296875 598.8427124023438 ...
  277.68634033203125 285.8544921875 295.01593017578125]
 [590.6581420898438 595.2238159179688 601.6572875976562 ...
  277.9685974121094 286.81414794921875 297.4723205566406]
 [589.5838623046875 594.1239013671875 601.8590087890625 ...
  277.1806640625 285.3682556152344 296.28765869140625]
 ...
 [382.80145263671875 382.2256774902344 381.4943542480469 ...
  550.7738037109375 556.2220458984375 564.4942016601562]
 [383.3029479980469 382.7760009765625 382.11358642578125 ...
  536.994873046875 544.2987060546875 555.5557250976562]
 [384.0695495605469 383.79473876953125 383.3280334472656 ...
  526.471923828125 531.2518920898438 541.6464233398438]]
In this particular case, the two DEMs are already on the same grid (they have the same bounds, resolution and coordinate system).
If they don’t, we need to reproject one DEM to fit the other.
xdem.DEM.reproject() is a multi-purpose method that ensures a fit each time:
/home/docs/checkouts/readthedocs.org/user_builds/xdem/conda/stable/lib/python3.11/site-packages/geoutils/raster/raster.py:2108: UserWarning: Output projection, bounds and size are identical -> return self (not a copy!)
  warnings.warn("Output projection, bounds and size are identical -> return self (not a copy!)")
Oops!
xdem just warned us that dem_1990 did not need reprojection, but we asked it to anyway.
To hide this prompt, add .reproject(..., silent=True).
By default, xdem.DEM.reproject() uses “bilinear” resampling (assuming resampling is needed).
Other options are “nearest” (fast but inaccurate), “cubic_spline”, “lanczos” and others.
See geoutils.Raster.reproject() and rasterio.enums.Resampling for more information about reprojection.
Now, we are ready to generate the dDEM:
[[-3.93341064453125 0.56048583984375 0.43316650390625 ... -0.905029296875
  1.251190185546875 1.248931884765625]
 [-4.99090576171875 -0.8433837890625 1.777099609375 ... -1.022705078125
  1.41357421875 1.101165771484375]
 [-4.79718017578125 -0.077392578125 0.85614013671875 ...
  -1.845123291015625 0.594970703125 0.50244140625]
 ...
 [-22.800140380859375 -23.033538818359375 -23.2056884765625 ...
  7.91156005859375 5.1590576171875 0.99896240234375]
 [-22.650543212890625 -22.81304931640625 -23.0987548828125 ...
  6.9542236328125 2.25823974609375 -5.52691650390625]
 [-22.637603759765625 -23.162109375 -23.580230712890625 ...
  2.9022216796875 1.25225830078125 -3.89849853515625]]
It is a new xdem.DEM instance, loaded in memory.
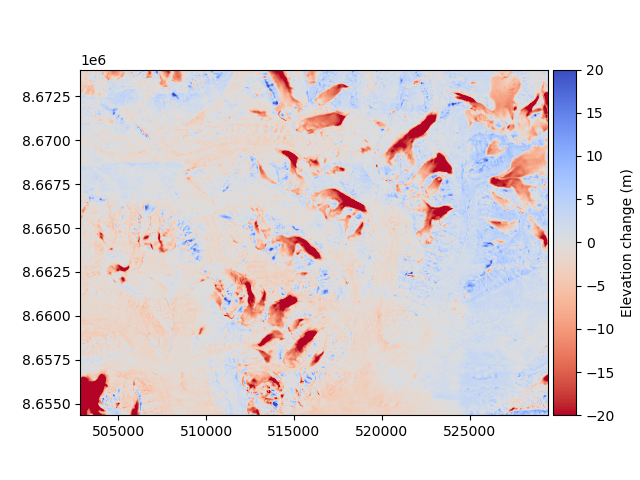
Let’s visualize it:
ddem.show(cmap="coolwarm_r", vmin=-20, vmax=20, cbar_title="Elevation change (m)")

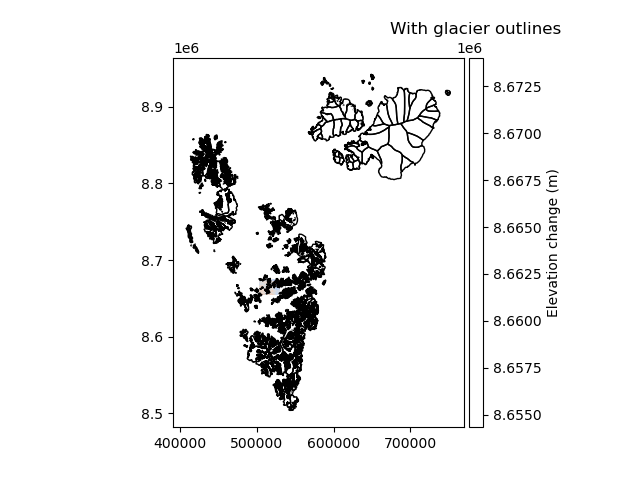
Let’s add some glacier outlines
# Load the outlines
glacier_outlines = gu.Vector(xdem.examples.get_path("longyearbyen_glacier_outlines"))

# Need to create a common matplotlib Axes to plot both on the same figure
# The xlim/ylim commands are necessary only because outlines extend further than the raster extent
ax = plt.subplot(111)
ddem.show(ax=ax, cmap="coolwarm_r", vmin=-20, vmax=20, cbar_title="Elevation change (m)")
glacier_outlines.ds.plot(ax=ax, fc="none", ec="k")
plt.xlim(ddem.bounds.left, ddem.bounds.right)
plt.ylim(ddem.bounds.bottom, ddem.bounds.top)
plt.title("With glacier outlines")
plt.show()

For missing values, xdem provides a number of interpolation methods which are shown in the other examples.
Saving the output to a file is also very simple
ddem.save("temp.tif")
… and that’s it!
Total running time of the script: (0 minutes 1.782 seconds)