Note
Go to the end to download the full example code.
DEM differencing#
Subtracting a DEM with another one should be easy.
xDEM allows to use any operator on xdem.DEM objects, such as + or - as well as most NumPy functions
while respecting nodata values and checking that georeferencing is consistent. This functionality is inherited from GeoUtils’ Raster class.
Before DEMs can be compared, they need to be reprojected to the same grid and have the same 3D CRSs. The reproject() and to_vcrs() methods are used for this.
import geoutils as gu

import xdem
We load two DEMs near Longyearbyen, Svalbard.
We can print the information about the DEMs for a “sanity check”.
Driver:               GTiff
Opened from file:     /home/docs/checkouts/readthedocs.org/user_builds/xdem/checkouts/latest/xdem/example_data/Longyearbyen/data/DEM_2009_ref.tif
Filename:             /home/docs/checkouts/readthedocs.org/user_builds/xdem/checkouts/latest/xdem/example_data/Longyearbyen/data/DEM_2009_ref.tif
Loaded?               False
Modified since load?  False
Grid size:            1332, 985
Number of bands:      1
Data types:           float32
Coordinate system:    ['EPSG:25833', 'None']
Nodata value:         -9999.0
Pixel interpretation: Area
Pixel size:           20.0, 20.0
Upper left corner:    502810.0, 8674030.0
Lower right corner:   529450.0, 8654330.0

Driver:               GTiff
Opened from file:     /home/docs/checkouts/readthedocs.org/user_builds/xdem/checkouts/latest/xdem/example_data/Longyearbyen/processed/DEM_1990_coreg.tif
Filename:             /home/docs/checkouts/readthedocs.org/user_builds/xdem/checkouts/latest/xdem/example_data/Longyearbyen/processed/DEM_1990_coreg.tif
Loaded?               False
Modified since load?  False
Grid size:            1332, 985
Number of bands:      1
Data types:           float32
Coordinate system:    ['EPSG:25833', 'None']
Nodata value:         -9999.0
Pixel interpretation: Area
Pixel size:           20.0, 20.0
Upper left corner:    502810.0, 8674030.0
Lower right corner:   529450.0, 8654330.0
In this particular case, the two DEMs are already on the same grid (they have the same bounds, resolution and coordinate system).
If they don’t, we need to reproject one DEM to fit the other using xdem.DEM.reproject():
/home/docs/checkouts/readthedocs.org/user_builds/xdem/conda/latest/lib/python3.14/site-packages/geoutils/raster/geotransformations.py:101: UserWarning: Output projection, bounds and grid size are identical -> returning self (not a copy!)
  warnings.warn("Output projection, bounds and grid size are identical -> returning self (not a copy!)")
Oops!
GeoUtils just warned us that dem_1990 did not need reprojection. We can hide this output with silent.
By default, reproject() uses “bilinear” resampling (assuming resampling is needed).
Other options are detailed at geoutils.Raster.reproject() and rasterio.enums.Resampling.
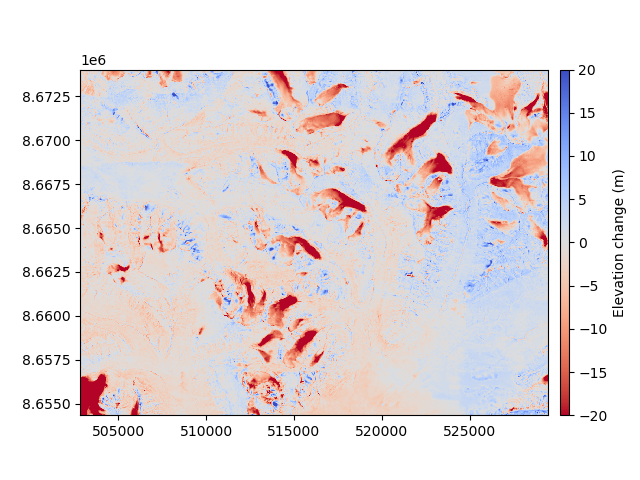
We now compute the difference by simply substracting, passing stats=True to xdem.DEM.info() to print statistics.
Driver:               None
Opened from file:     None
Filename:             None
Loaded?               True
Modified since load?  True
Grid size:            1332, 985
Number of bands:      1
Data types:           float32
Coordinate system:    ['EPSG:25833', 'None']
Nodata value:         -9999.0
Pixel interpretation: Area
Pixel size:           20.0, 20.0
Upper left corner:    502810.0, 8674030.0
Lower right corner:   529450.0, 8654330.0

Statistics:
Mean                   : -1.19
Median                 : -0.37
Max                    : 49.90
Min                    : -50.32
Sum                    : -1560131.12
Sum of squares         : 42497068.00
90th percentile        : 3.33
LE90                   : 16.11
IQR                    : 3.82
NMAD                   : 2.83
RMSE                   : 5.69
Standard deviation     : 5.57
Valid count            : 1312020.00
Total count            : 1312020.00
Percentage valid points: 100.00
It is a new DEM instance, loaded in memory.
Let’s visualize it, with some glacier outlines.
# Load the outlines
glacier_outlines = gu.Vector(xdem.examples.get_path("longyearbyen_glacier_outlines"))
glacier_outlines = glacier_outlines.crop(ddem, clip=True)
ddem.plot(cmap="RdYlBu", vmin=-20, vmax=20, cbar_title="Elevation differences (m)")
glacier_outlines.plot(ref_crs=ddem, fc="none", ec="k")
And we save the output to file.
ddem.to_file("temp.tif")
Total running time of the script: (0 minutes 4.065 seconds)