Analysis of accuracy and precision#
Digital Elevation Models are numerical, gridded representations of elevation. They are generated from different instruments (e.g., optical sensors, radar, lidar), acquired in different conditions (e.g., ground, airborne, satellite) , and using different post-processing techniques (e.g., photogrammetry, interferometry).
While some complexities are specific to certain instruments and methods, all DEMs generally possess:
a ground sampling distance (GSD), or pixel size, that does not necessarily represent the underlying spatial resolution of the observations,
a georeferencing that can be subject to shifts, tilts or other deformations due to inherent instrument errors, noise, or associated processing schemes,
a large number of outliers that remain difficult to filter as they can originate from various sources (e.g., photogrammetric blunders, clouds).
These factors lead to difficulties in assessing the accuracy and precision of DEMs, which are necessary to perform further analysis.
In xDEM, we provide a framework with state-of-the-art methods published in the scientific literature to make DEM calculations consistent, reproducible, and easy.
Accuracy and precision#
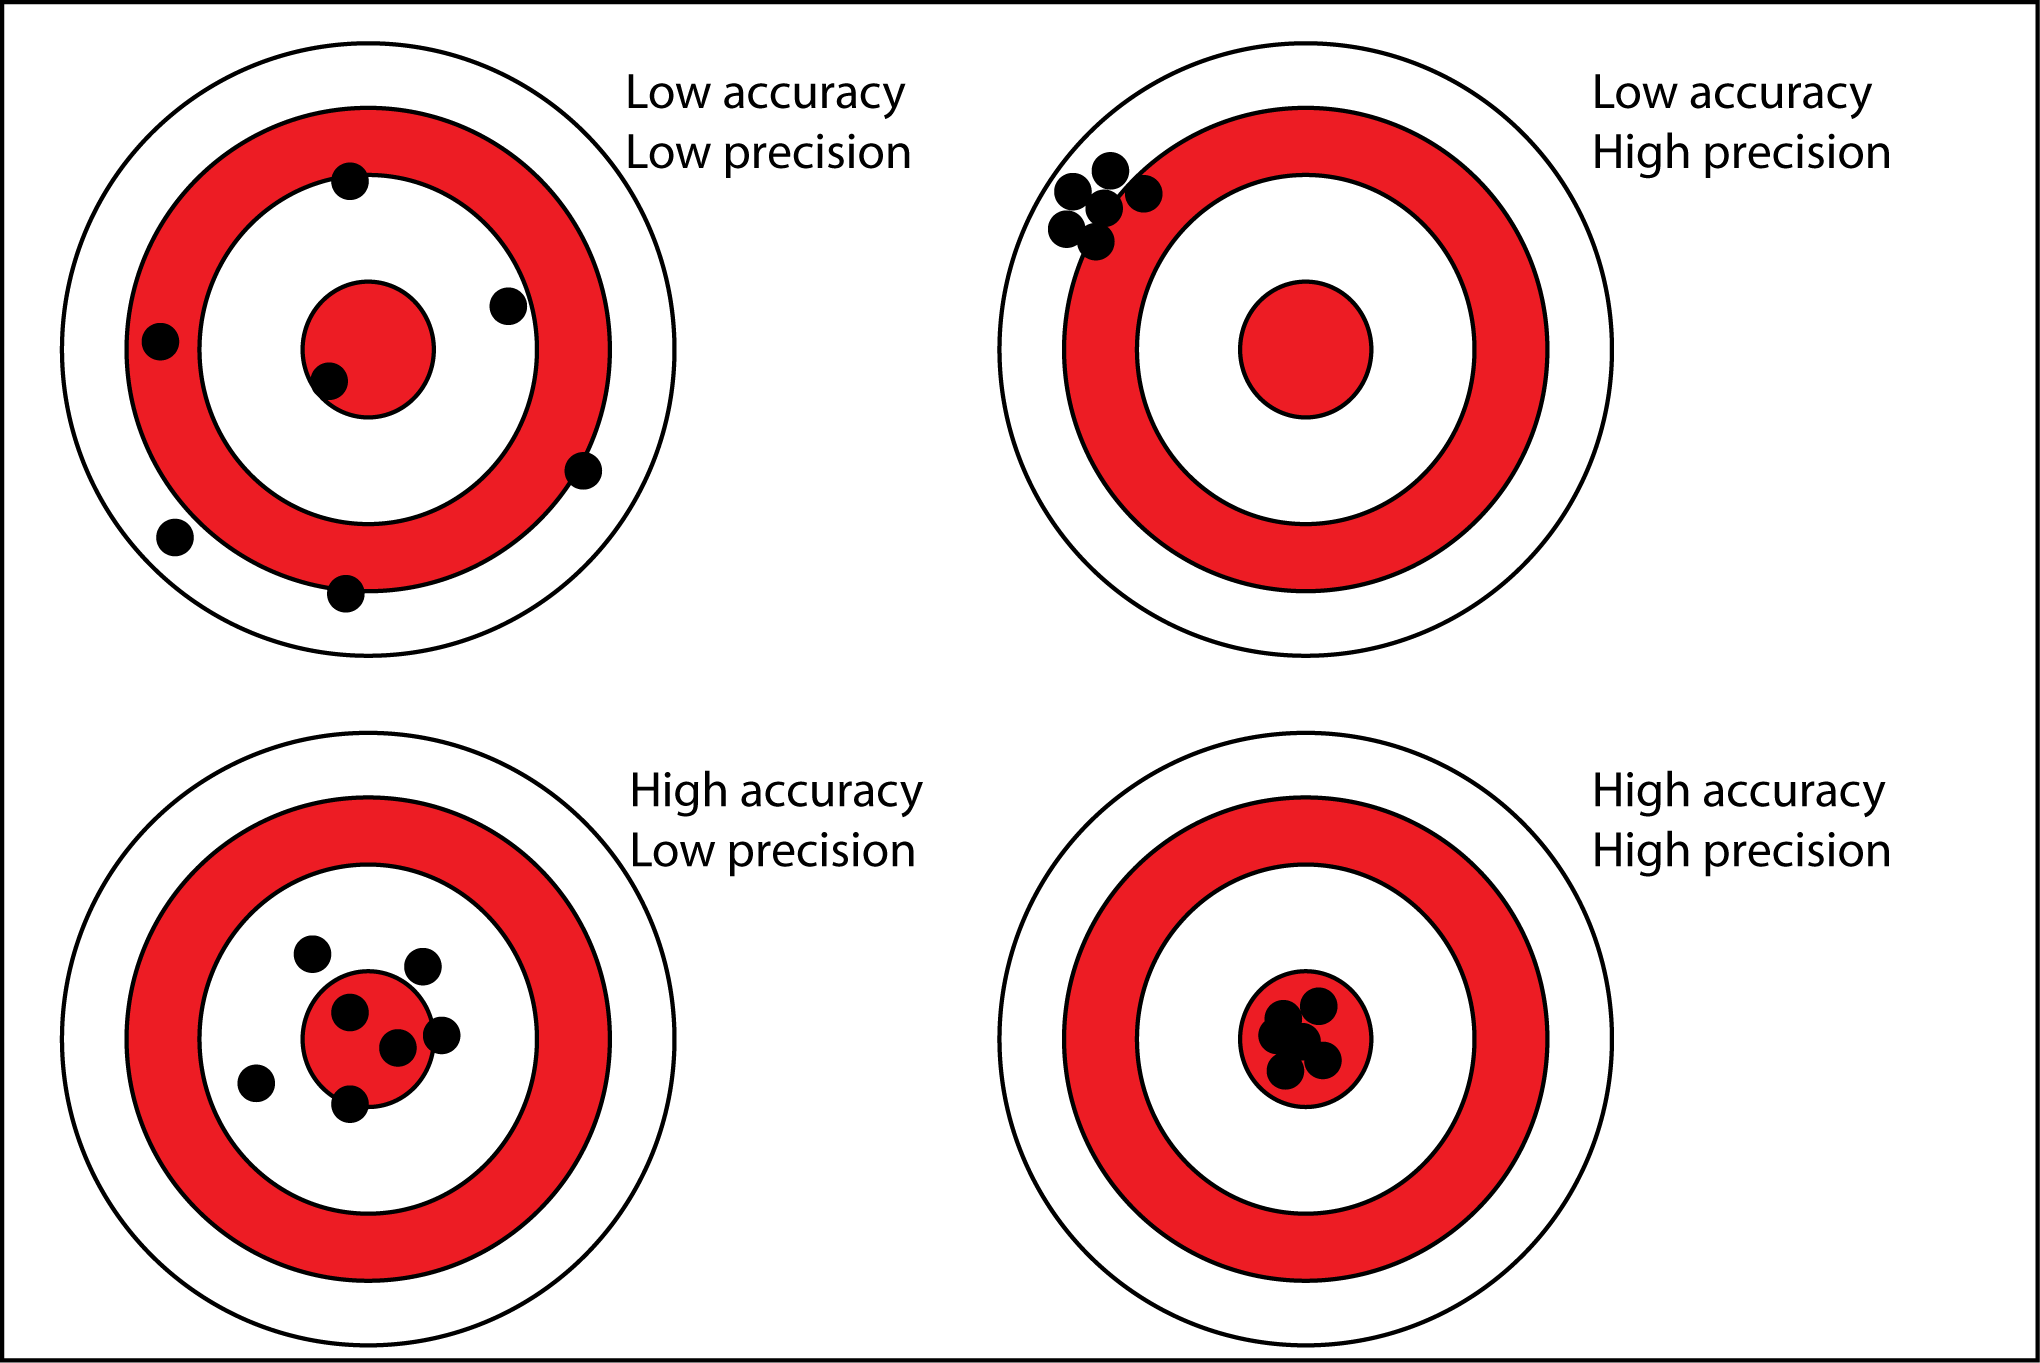
Accuracy and precision describe random and systematic errors, respectively.
Note: sometimes “accuracy” is also used to describe both types of errors, and “trueness” systematic errors, as defined in ISO 5725-1 . Here, we used accuracy for systematic errors as, to our knowledge, it is a more commonly used terminology in remote sensing applications.
Source: antarcticglaciers.org, accessed 29.06.21.#
For DEMs, we thus have:
DEM accuracy (systematic error) describes how close a DEM is to the true location of measured elevations on the Earth’s surface,
DEM precision (random error) of a DEM describes the typical spread of its error in measurement, independently of a possible bias from the true positioning.
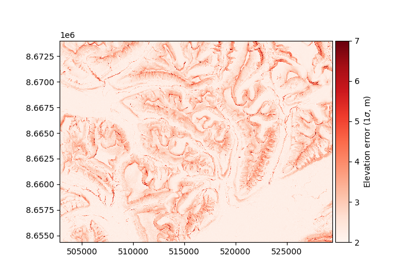
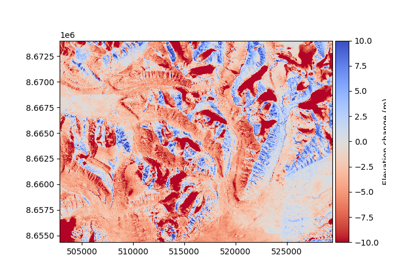
The spatial structure of DEMs complexifies the notion of accuracy and precision, however. Spatially structured systematic errors are often related to the gridded nature of DEMs, creating affine biases while other, specific biases exist at the pixel scale. For random errors, a variability in error magnitude or heteroscedasticity exists across the DEM, while spatially structured patterns of errors are linked to spatial correlations.

Source: Hugonnet et al. (2022).#
Absolute or relative accuracy#
The measure of accuracy can be further divided into two aspects:
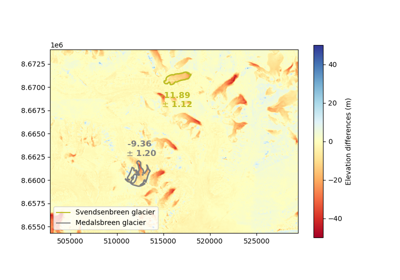
the absolute accuracy of a DEM describes the average shift to the true positioning. Studies interested in analyzing features of a single DEM in relation to other georeferenced data might give great importance to this potential bias.
the relative accuracy of a DEM is related to the potential shifts, tilts, and deformations with reference to other elevation data that does not necessarily matches the true positioning. Studies interested in comparing DEMs between themselves might be only interested in this accuracy.
TODO: Add another little schematic!
Optimizing DEM absolute accuracy#
Shifts due to poor absolute accuracy are common in elevation datasets, and can be easily corrected by performing a DEM co-registration to precise and accurate, quality-controlled elevation data such as ICESat and ICESat-2. Quality-controlled DEMs aligned on high-accuracy data also exists, such as TanDEM-X global DEM (see Rizzoli et al. (2017)).
Those biases can be corrected using the methods described in Coregistration.
Examples that use coregistration functions#

Optimizing DEM relative accuracy#
As the absolute accuracy can be corrected a posteriori using reference elevation datasets, many analyses only focus on relative accuracy, i.e. the remaining biases between several DEMs co-registered relative one to another. By harnessing the denser, nearly continuous sampling of raster DEMs (in opposition to the sparser sampling of higher-accuracy point elevation data), one can identify and correct other types of biases:
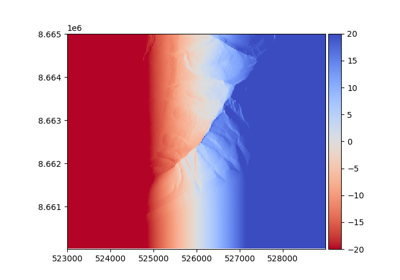
Terrain-related biases that can originate from the difference of resolution of DEMs, or instrument processing deformations (e.g., curvature-related biases described in Gardelle et al. (2012)).
Directional biases that can be linked to instrument noise, such as along-track oscillations observed in many widepsread DEM products such as SRTM, ASTER, SPOT, Pléiades (e.g., Girod et al. (2017)).
Those biases can be tackled by iteratively combining co-registration and bias-correction methods described in Coregistration and Bias correction.
TODO: add mini-gallery for bias correction methods
Quantifying DEM precision#
While dealing with accuracy is quite straightforward as it consists of minimizing the differences (biases) between several datasets, assessing the precision of DEMs can be much more complex. Measurement errors of a DEM cannot be quantified by a simple difference and require statistical inference.
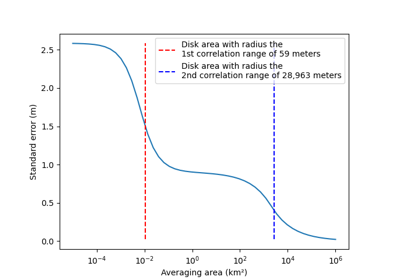
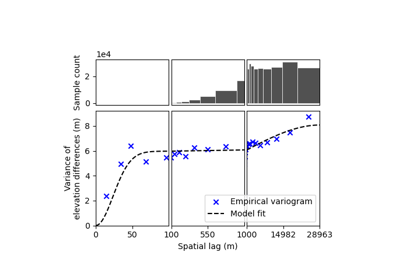
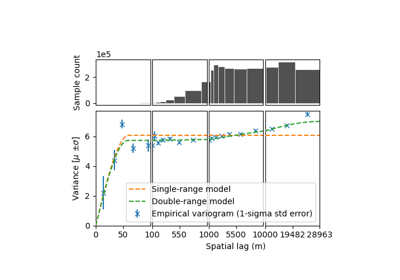
The precision of DEMs has historically been reported by a single metric (e.g., precision of \(\pm\) 2 m), but recent studies (e.g., Rolstad et al. (2009), Dehecq et al. (2020) and Hugonnet et al. (2021)) have shown the limitations of such simple metrics and provide more statistically-advanced methods to account for potential variabilities in precision and related correlations in space. However, the lack of implementations of these methods in a modern programming language makes them hard to reproduce, validate, and apply consistently. This is why one of the main goals of xDEM is to simplify state-of-the-art statistical measures, to allow accurate DEM uncertainty estimation for everyone.
The tools for quantifying DEM precision are described in spatialstats.